1QFY2019 Result Update | Dairy Products
August 8, 2018
Parag Milk Foods
BUY
CMP
`324
Performance Update
Target Price
`410
Y/E March (` cr)
Q1FY19
Q1FY18
% yoy
Q4FY18
% qoq
Investment Period
12 Months
Net sales
549
413
32.9
518
5.9
EBITDA
60
29
103%
55
8.4%
Stock Info
EBITDA margin (%)
10.9%
7.1%
376
10.6%
23
Sector
Dairy Products
Adjusted PAT
28
11
154.5
26
7.7
Market Cap (` cr)
2,733
Net Debt (` cr)
214
For Q1FY2019, Parag Milk Foods (PARAG) posted decent performance with
Beta
1.1
33%/168% yoy growth in revenue/ PAT led by 376 bps expansion in margin. The
52 Week High / Low
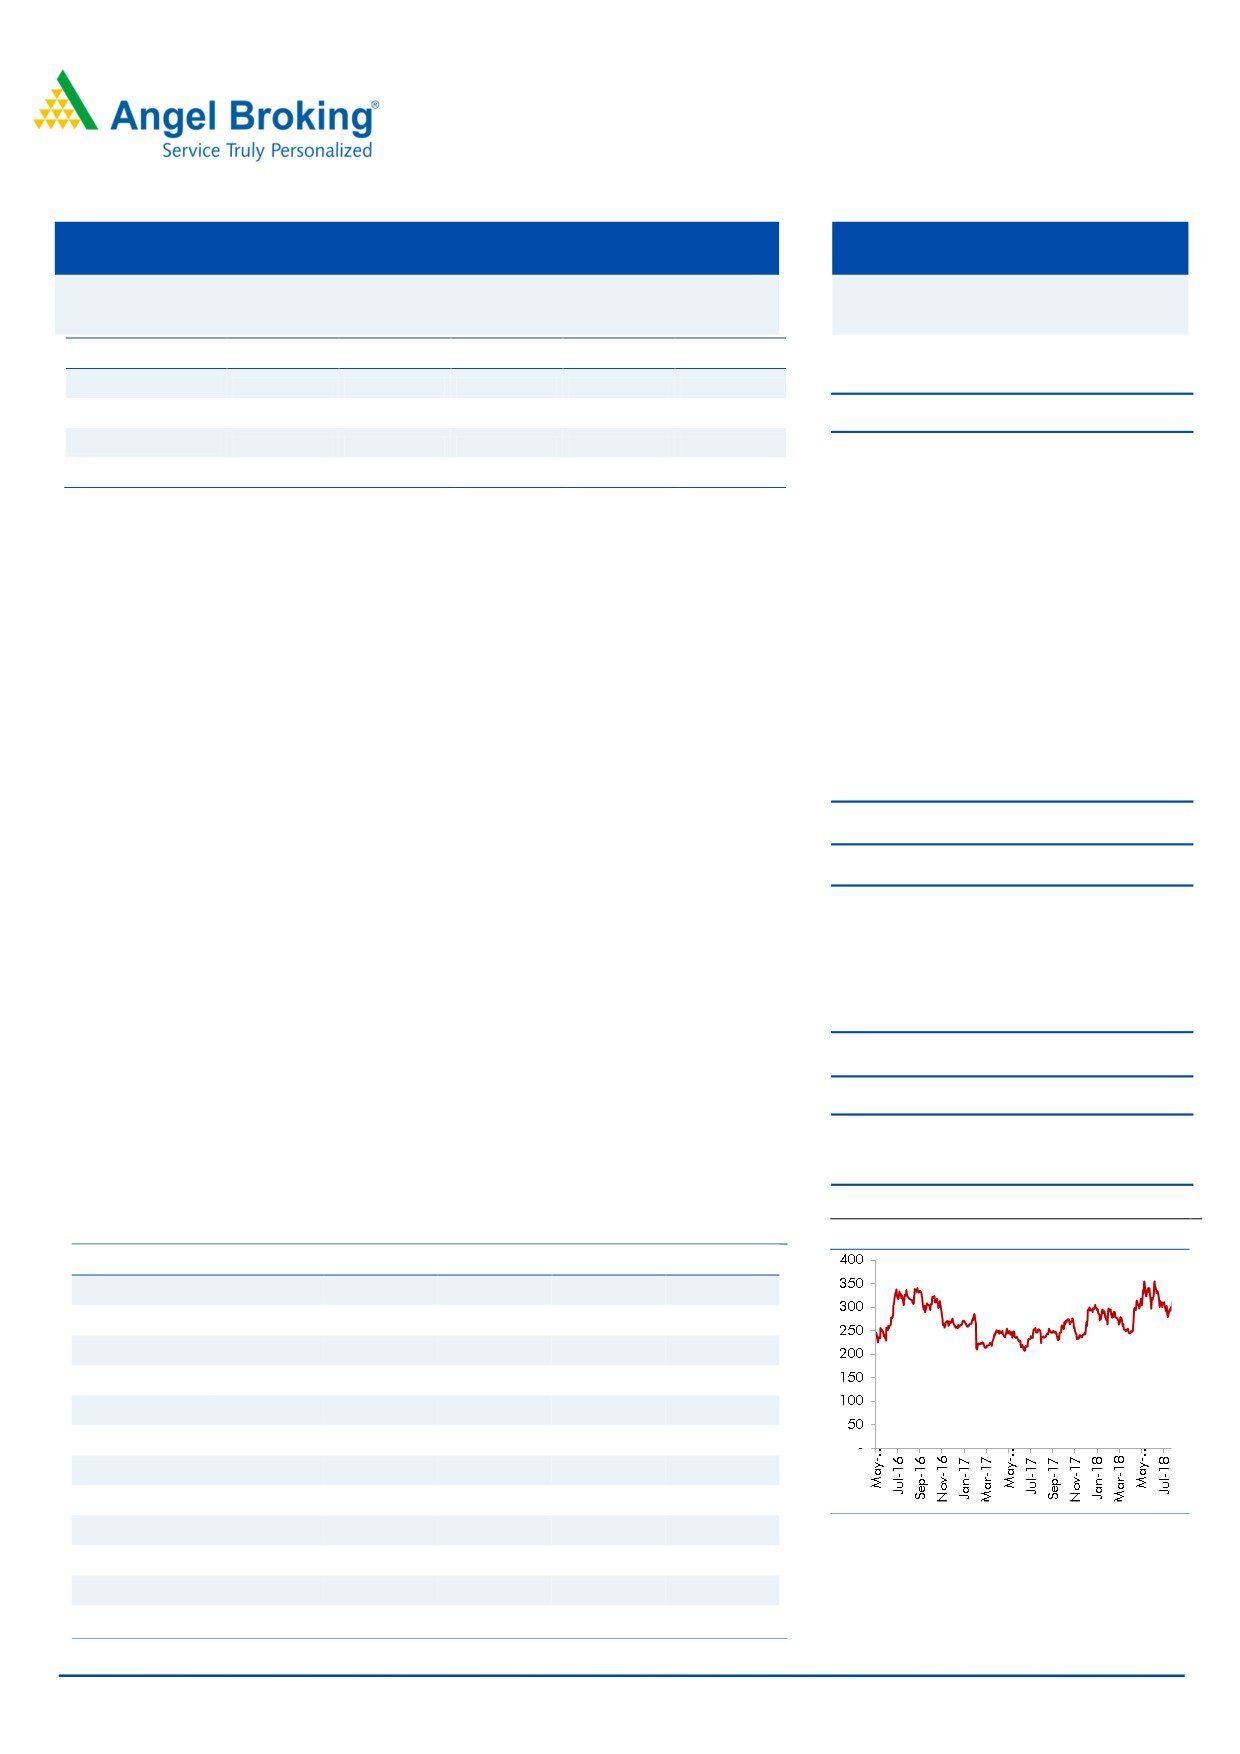
414/220
company has delivered strong results amid various concerns like farmers strike,
Avg. Daily Volume
2,43,852
rise in procurement prices of raw milk which reiterates our conviction in its
Face Value (`)
10
premiumisation story.
BSE Sensex
37,670
Revenue rose 33%: Its Q1’s top-line rose due to 41% yoy growth in the high-
Nifty
11,391
margin Value Added Products (VAP) segment. It is introducing many new
Reuters Code
PAMF.NS
products/ variants of existing products like premium ghee, protein powder, Mishti
Bloomberg Code
PARAG.IN
Doi which would boost its revenue in coming quarters.
Margins were decent: On the operating front, the company’s margin were robust
Shareholding Pattern (%)
at 10.9% due to operating leverage and better product mix. The company has
Promoters
46.0
guided for 11-12% by FY2020 on the back of improving product mix and
MF / Banks / Indian Fls
12.3
distribution network.
FII / NRIs / OCBs
15.9
Outlook and Valuation: We have maintained our earnings estimates in view of
Indian Public / Others
25.8
new products pipeline and robust Q1 performance. We now expect PARAG to
report a CAGR of ~17%/35% in revenue/ earnings over FY18-20E. The stock is
Abs. (%)
3m 1yr
3yr
currently trading at 16.9x its FY2020 earnings, which still looks attractive looking
Sensex
7.0
16.7
33.4
at its evolving FMCG story. We maintain BUY with a target price of `410 (21x
PARAG
3.7
29.9
-
FY2020E EPS).
Key Financials
Price Chart
Y/E March (` cr)
FY2016
FY2017
FY2018
FY2019E
FY2020E
Net Sales
1,645
1,731
1,986
2,271
2,706
% chg
13.9
5.2
14.8
14.3
19.2
Net Profit
49.4
35.9
89.2
115.4
162.1
% chg
33.0
(27.2)
148.1
29.4
40.5
OPM (%)
9.0
5.1
10.0
10.4
11.1
EPS (Rs)
5.9
4.3
10.6
13.7
19.3
P/E (x)
55.4
76.1
30.7
23.7
16.9
P/BV (x)
5.8
3.2
2.8
2.4
2.1
RoE (%)
13.6
5.5
12.0
13.4
15.9
Source: Company, Angel Research
RoCE (%)
15.3
4.3
15.3
17.2
20.8
Nidhi Agrawal
EV/Sales (x)
1.9
1.7
1.4
1.3
1.0
022 - 3935 7800 Ext: 6872
EV/EBITDA (x)
21.0
32.6
14.4
12.2
9.4
Source: Company, Angel Research
Please refer to important disclosures at the end of this report
1
Parag Milk Foods |1QFY2019 Result Update
Exhibit 1: Q1FY2019 Performance
In Cr
Q1FY18
Q4FY18
Q1FY19
YOY %
QOQ%
Net Sales
413
518
549
33.1%
6.1%
Total Income
414
518
549
32.6%
6.1%
Total Expenditure
383
463
490
27.7%
5.8%
Raw Material Consumed
328
374
335
2.3%
-10.3%
Stock Adjustment
-36
-36
6
-118.0%
-118%
Purchase of Finished Goods
1
14
41
3670%
182.2%
COGS
293
352
383
30.6%
8.6%
Employee Expenses
19
22
20
7.7%
-5.2%
Other Expenses
72
89
87
21.0%
-2.6%
As a % of sales
Raw Material Consumed
79%
72%
61%
-15.4%
Stock Adjustment
-9%
-7%
1%
Purchase of Finished Goods
0%
3%
7%
166.0%
COGS
71%
68%
70%
2.4%
Gross Margin %
29%
32%
30%
-5.1%
Employee Expenses
5%
4%
4%
-10.7%
Other Expenses
17%
17%
16%
-8.2%
EBITDA
29
55
60
103%
8.4%
Other Income
2
4
2
14.8%
-59.1%
Interest
8
10
10
29.7%
6.6%
PBDT
23
50
51
122.6%
2.9%
Depreciation
12
12
14
17.2%
8.6%
PBT
11
37
38
229.3%
0.9%
Tax
3
11
9
176.9%
-15.8%
PAT
11
26
28
168.5%
8.1%
Ratios
EBITDA margin (%)
7.1%
10.6%
10.9%
PAT margin %
2.6%
5.0%
5.1%
Tax rate %
29.8%
30.0%
25.0%
Source: Company, Angel Research
August 8, 2018
2
Parag Milk Foods |1QFY2019 Result Update
Outlook and Valuation
We have maintained our earnings estimates in view of new products
pipeline and robust Q1 performance. We now expect PARAG to report a
CAGR of ~17%/35% in revenue/ earnings over FY18-20E.
We also feel that the higher contribution of nutrition and wellness ( 30%
gross margin segment expected to touch 7% from current 2% share)
would further boost margins. Also, the other products in pipeline like
Mishti Doi, premium ghee etc. holds great potential.
Its recent acquisition of Danone facilty in North India is likely to improve
its presence there across various products like curd etc. PARAG is also in
talks with various farmers to improve supply chain in North and East
India. It has so far invested 18 cr in the facility which has recently
commenced its operation.
Valuation
The stock is currently trading at 16.9x its FY2020 earnings, which still looks
attractive looking at its evolving FMCG story. Hence, we recommend a buy with a
target price of `410 (21x FY2020E EPS).
Risks to our estimates
1) Inability to procure sufficient good quality raw milk at commercially viable
prices
2) Increase in competitive intensity
August 8, 2018
3
Parag Milk Foods |1QFY2019 Result Update
Profit & Loss Statement
Y/E March (` cr)
FY2016
FY2017
FY2018
FY2019E FY2020E
Total operating income
1,645
1,731
1,986
2,271
2,706
% chg
13.9
5.2
14.8
14.3
19.2
Total Expenditure
1,497
1,642
1,788
2,036
2,406
Raw Material
1,333
1,414
1,703
1,754
2,070
Personnel
67
79
85
95
114
Selling and Administration Expenses
82.4
113.1
-
140.8
167.8
Others Expenses
15
36
-
45
54
EBITDA
148
89
198
235
300
% chg
38.2
(40.1)
122.9
18.9
27.7
(% of Net Sales)
9.0
5.1
10.0
10.4
11.1
Depreciation& Amortisation
33
49
52
59
65
EBIT
115
40
146
176
236
% chg
44.1
(65.3)
267.3
20.3
34.0
(% of Net Sales)
7.0
2.3
7.4
7.7
8.7
Interest & other Charges
50
33
36
22
14
Other Income
2
11
9
5
5
(% of PBT)
2.3
62.7
7.9
3.1
2.2
Share in profit of Associates
-
-
-
-
-
Recurring PBT
67
18
119
159
227
% chg
94.9
(73.8)
581.0
33.4
42.4
Tax
19
0
30
44
65
(% of PBT)
29.2
2.3
25.3
27.5
28.5
PAT (reported)
47
17
89
115
162
Extraordinary Items
(2)
(19)
-
-
-
Less: Minority interest (MI)
0
0
0
0
0
PAT after MI (reported)
47
17
89
115
162
ADJ. PAT
49
36
89
115
162
% chg
33.0
(27.2)
148.1
29.4
40.5
(% of Net Sales)
3.0
2.1
4.5
5.1
6.0
Fully Diluted EPS (Rs)
5.9
4.3
10.6
13.7
19.3
% chg
33.0
(27.2)
148.1
29.4
40.5
August 8, 2018
4
Parag Milk Foods |1QFY2019 Result Update
Consolidated Balance Sheet
Y/E March (` cr)
FY2016
FY2017
FY2018
FY2019E
FY2020E
SOURCES OF FUNDS
Equity Share Capital
70
84
84
84
84
Reserves& Surplus
291
573
660
774
935
Shareholders’ Funds
362
657
744
858
1,019
Equity Share Warrants
-
-
-
-
-
Total Loans
389
262
212
162
112
Deferred Tax Liability
-
-
-
-
-
Other liabilities
18.7
18.1
18.1
18.1
18.1
Total Liabilities
769
938
974
1,039
1,150
APPLICATION OF FUNDS
Gross Block
528
585
645
705
765
Less: Acc. Depreciation
183
226
280
340
404
Net Block
345
359
365
365
361
Capital Work-in-Progress
28
21
24
24
24
Investments
0
-
-
-
-
Current Assets
602
878
954
1,012
1,178
Inventories
272
429
455
529
630
Sundry Debtors
236
215
241
280
334
Cash
8
101
108
28
5
Loans & Advances
85
133
151
175
209
Other Assets
-
-
-
-
-
Current liabilities
211
382
453
474
560
Net Current Assets
391
496
502
538
618
Deferred Tax Asset
(11)
(10)
(11)
(12)
(12)
Mis. Exp. not written off
17
73
94
123
160
Total Assets
769
938
974
1,039
1,150
August 8, 2018
5
Parag Milk Foods |1QFY2019 Result Update
Consolidated Cash Flow Statement
Y/E March (` cr)
FY2016
FY2017
FY2018
FY2019E FY2020E
Profit before tax
67
18
119
159
227
Depreciation
33
49
51
59
65
Change in Working Capital
0
0
1
(116)
(103)
Interest / Dividend (Net)
47
25
36
22
14
Direct taxes paid
(14)
(16)
(32)
(44)
(65)
Others
(75)
(11)
0
0
0
Cash Flow from Operations
59
64
174
81
138
(Inc.)/ Dec. in Fixed Assets
(27)
(97)
(60)
(60)
(60)
(Inc.)/ Dec. in Investments
(4)
6
(22)
(28)
(37)
Cash Flow from Investing
(31)
(91)
(82)
(88)
(97)
Issue of Equity
6
278
0
0
0
Inc./(Dec.) in loans
60
0
(50)
(50)
(50)
Dividend Paid (Incl. Tax)
0
0
0
0
0
Interest / Dividend (Net)
(55)
(31)
(36)
(22)
(14)
Cash Flow from Financing
(26)
123
(86)
(72)
(64)
Inc./(Dec.) in Cash
1
96
7
(79)
(23)
Opening Cash balances
4
5
101
108
28
Closing Cash balances
5
101
108
28
5
August 8, 2018
6
Parag Milk Foods |1QFY2019 Result Update
Key Ratios
Y/E March
FY2016
FY2017
FY2018
FY2019E
FY2020E
Valuation Ratio (x)
P/E (on FDEPS)
55.4
76.1
30.7
23.7
16.9
P/CEPS
26.0
31.7
14.9
12.0
9.2
P/BV
5.8
3.2
2.8
2.4
2.1
Dividend yield (%)
0.1
0.1
0.0
0.0
0.0
EV/Sales
1.9
1.7
1.4
1.3
1.0
EV/EBITDA
21.0
32.6
14.4
12.2
9.4
EV / Total Assets
4.0
3.1
2.9
2.7
2.5
Per Share Data (`)
EPS (Basic)
5.9
4.3
10.6
13.7
19.3
EPS (fully diluted)
5.9
4.3
10.6
13.7
19.3
Cash EPS
9.6
7.9
16.7
20.8
27.0
DPS
0.2
0.4
0.1
0.1
0.1
Book Value
43.0
78.2
88.7
102.3
121.4
Dupont Analysis
EBIT margin
7.0
2.3
7.4
7.7
8.7
Tax retention ratio
0.7
1.0
0.7
0.7
0.7
Asset turnover (x)
2.2
2.1
2.3
2.3
2.4
ROIC (Post-tax)
10.9
4.8
12.8
12.9
15.0
Cost of Debt (Post Tax)
0.1
0.1
0.1
0.1
0.1
Returns (%)
ROCE
15.3
4.3
15.3
17.2
20.8
Angel ROIC (Pre-tax)
15.5
4.9
17.1
17.8
20.9
ROE
13.6
5.5
12.0
13.4
15.9
Turnover ratios (x)
Asset Turnover (Gross Block)
3.1
3.0
3.1
3.2
3.5
Inventory / Sales (days)
60
90
92
85
85
Receivables (days)
52
45
53
45
45
Payables (days)
58
99
102
99
99
Working capital cycle (ex-cash) (days)
55
37
43
31
31
Source: Company, Angel Research
August 8, 2018
7
Parag Milk Foods |1QFY2019 Result Update
Research Team Tel: 022 - 39357800
DISCLAIMER:
Angel Broking Limited (hereinafter referred to as “Angel”) is a registered Member of National Stock Exchange of India Limited, Bombay
Stock Exchange Limited, Metropolitan Stock Exchange Limited, Multi Commodity Exchange of India Ltd and National Commodity &
Derivatives Exchange Ltd It is also registered as a Depository Participant with CDSL and Portfolio Manager and Investment Adviser with
SEBI. It also has registration with AMFI as a Mutual Fund Distributor. Angel Broking Limited is a registered entity with SEBI for Research
Analyst in terms of SEBI (Research Analyst) Regulations, 2014 vide registration number INH000000164. Angel or its associates has not
been debarred/ suspended by SEBI or any other regulatory authority for accessing /dealing in securities Market. Angel or its
associates/analyst has not received any compensation / managed or co-managed public offering of securities of the company covered
by Analyst during the past twelve months.
This document is solely for the personal information of the recipient, and must not be singularly used as the basis of any investment
decision. Nothing in this document should be construed as investment or financial advice. Each recipient of this document should make
such investigations as they deem necessary to arrive at an independent evaluation of an investment in the securities of the companies
referred to in this document (including the merits and risks involved), and should consult their own advisors to determine the merits and
risks of such an investment.
Reports based on technical and derivative analysis center on studying charts of a stock's price movement, outstanding positions and
trading volume, as opposed to focusing on a company's fundamentals and, as such, may not match with a report on a company's
fundamentals. Investors are advised to refer the Fundamental and Technical Research Reports available on our website to evaluate the
contrary view, if any
The information in this document has been printed on the basis of publicly available information, internal data and other reliable
sources believed to be true, but we do not represent that it is accurate or complete and it should not be relied on as such, as this
document is for general guidance only. Angel Broking Limited or any of its affiliates/ group companies shall not be in any way
responsible for any loss or damage that may arise to any person from any inadvertent error in the information contained in this report.
Angel Broking Limited has not independently verified all the information contained within this document. Accordingly, we cannot testify,
nor make any representation or warranty, express or implied, to the accuracy, contents or data contained within this document. While
Angel Broking Limited endeavors to update on a reasonable basis the information discussed in this material, there may be regulatory,
compliance, or other reasons that prevent us from doing so.
This document is being supplied to you solely for your information, and its contents, information or data may not be reproduced,
redistributed or passed on, directly or indirectly.
Neither Angel Broking Limited, nor its directors, employees or affiliates shall be liable for any loss or damage that may arise from or in
connection with the use of this information.
Disclosure of Interest Statement
Parag Milk Foods
1. Financial interest of research analyst or Angel or his Associate or his relative
No
2. Ownership of 1% or more of the stock by research analyst or Angel or associates or
No
relatives
3. Served as an officer, director or employee of the company covered under Research
No
4. Broking relationship with company covered under Research
No
Ratings (Based on Expected Returns:
Buy (> 15%)
Accumulate (5% to 15%)
Neutral (-5 to 5%)
over 12 months investment period)
Reduce (-5% to -15%)
Sell (< -15%)
August 8, 2018
8